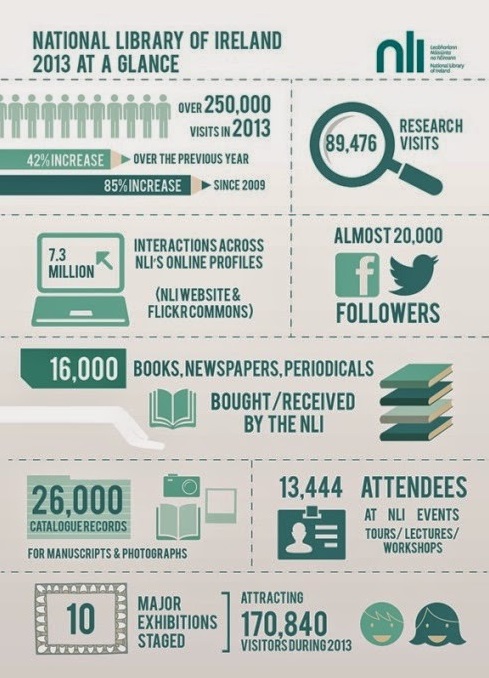
I've always admired the National Library's Infographics. They're clear, well laid out and easy to read. They use terms that anyone, not just #libraryland people, can recognise and their icons are equally well thought out.
 |
| https://blogger.googleusercontent.com/img/b/R29vZ2xl/AVvXsEhQIeBDSZOM0Fzx8c6SmML0jeUnPfNT-XARhhwy5Y3Yt6mM5xHik_DOtxanuJk1_9AVQZZuAqwWyPFs1zu6HO7yDRpQJBz_YJexkD8eUiFgVXRCFtMsuLSjUYD4vH3laNEPDJMDxN7L4csg/s1600/NLI-Infographic-491.jpg | | | |
They're widely used on other websites. I got the above one from
Irish Genealogy News. The infographic was released in conjunction with the National Library of Ireland's Annual Report for 2013 which let's face it was probably interesting to a small group of people and rather dry for a larger group of people. I'll be upfront and say I read annual reports for fun so I'd be in that small group. To most people though the infographic is a much more digestible way of seeing what it is that the National Library does. As I discussed in an earlier blog being able to communicate visually harnesses Gardner's Multiple Intelligences Theory. This infographic discusses how despite diminishing resources on all counts and being at a critical point the National Library is still there doing what a library does.
Should our library decide to go down this route I think it would work very well indeed.
No comments:
Post a Comment